Click here to download the 2025 Annual Pulse Report.
Click here to download the latest data snapshot for Higher Education and Student Loan Payments.
Click here to download the latest snapshot about the Consumer Experience.
While exploring this site, you can interact with statistics and charts to see how the data changes based on your specific interests. Be sure to click on our Data Guide for more information and navigational assistance.
To begin, let’s explore the number of bills paid per month, as well as the bills consumers perceive as most important.
Question: How many bills have you personally paid on a monthly basis over the past 12 months?
Question: Please select all of the bills for which you personally have submitted monthly payments over the past 12 months.*
*Subscriptions and Higher Education began to be measured in 2020.
Question: If you could only pay one of these bills next month, which would you choose to pay?
Next we’ll examine trends in payment “channels,” or the different ways a payment can be delivered or received.
Question: How many payment channels do you typically use to pay your monthly bills?
(Biller’s Website, Biller’s Mobile App, Phone via CSR, Phone via IVR, Mobile Wallet, Mail, In Person at the Biller’s Office / Location, Bank’s Website, Bank’s Mobile App, In Person at a Bank Branch, Third-Party Website, In Person at a Third-Party Payment Provider, Virtual Voice Assistant, Text Message)Question: Within the last 12 months, which of the following payment channels have you used to pay for each of your monthly bills?*
*Virtual Voice Assistant began to be measured in 1H 2020, while Text Message began to be measured in 2H 2020.
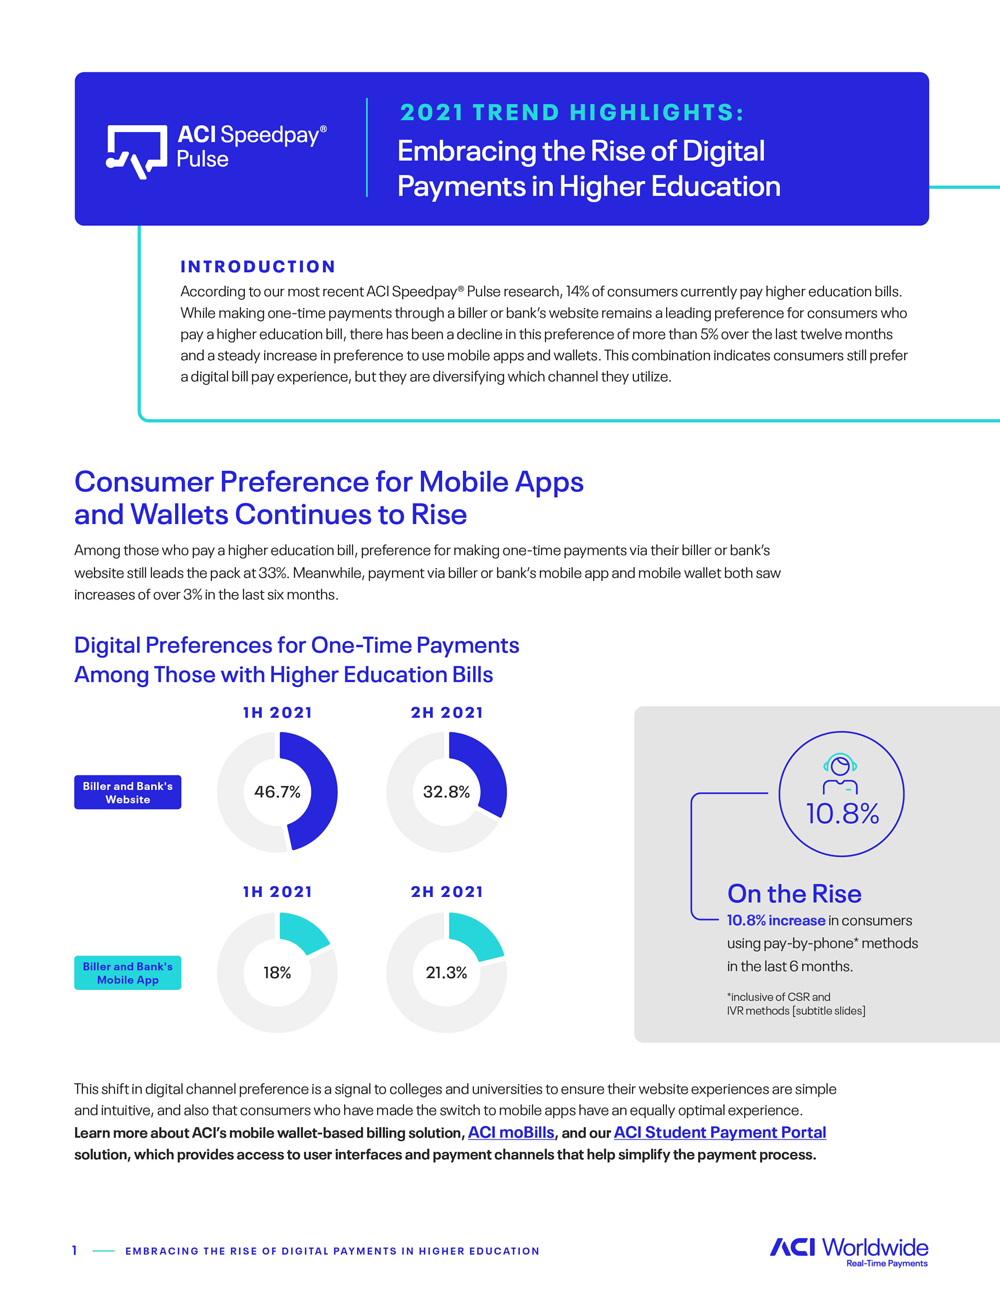
Question: What is your preferred channel for making one-time bill payments?*
*Virtual Voice Assistant began to be measured in 1H 2020, while Text Message began to be measured in 2H 2020.
**Subscriptions and Higher Education began to be measured in 2020.
Question: What is your preferred channel for making one-time bill payments?*
*Prior to 2020, “Mobile/Smart Devices” was referred to as “Mobile Payments” because Virtual Voice Assistant only began to be measured in 1H 2020.
**Subscriptions and Higher Education began to be measured in 2020.
Question: What is/would be your preferred channel for setting up recurring bill payments?
Now, we’ll take a look at trends in payment “methods,” or the forms of money or currency that can be used to pay bills.
Question: How many payment methods do you typically use to pay your monthly bills?
(Credit Card, Debit Card, Checking Account Deduction, Traditional Paper Check, Cash, Savings Account Deduction, Payroll Deduction, Money Order, Prepaid Card)Question: Within the last 12 months, which of the following payment methods have you used to pay for each of your monthly bills?
Question: What is your preferred method for making one-time bill payments?
Preferred method for one-time bill payment*Subscriptions and Higher Education began to be measured in 2020.
Question: What is your preferred method for making recurring bill payments?
*Subscriptions and Higher Education began to be measured in 2020.
Let’s explore trends in how consumers prefer to receive their billing statements and notifications when a bill is due.
Question: How do you prefer to receive your billing statements?
*Subscriptions and Higher Education began to be measured in 2020.
Question: In general, which of the following do you prefer most when it comes to receiving your bill notifications/reminders?
*Subscriptions and Higher Education began to be measured in 2020.
Let’s now look at trends in how consumers prefer to make urgent payments when necessary.
Question: When you pay a bill late, which of the following best represents the most frequent reason?
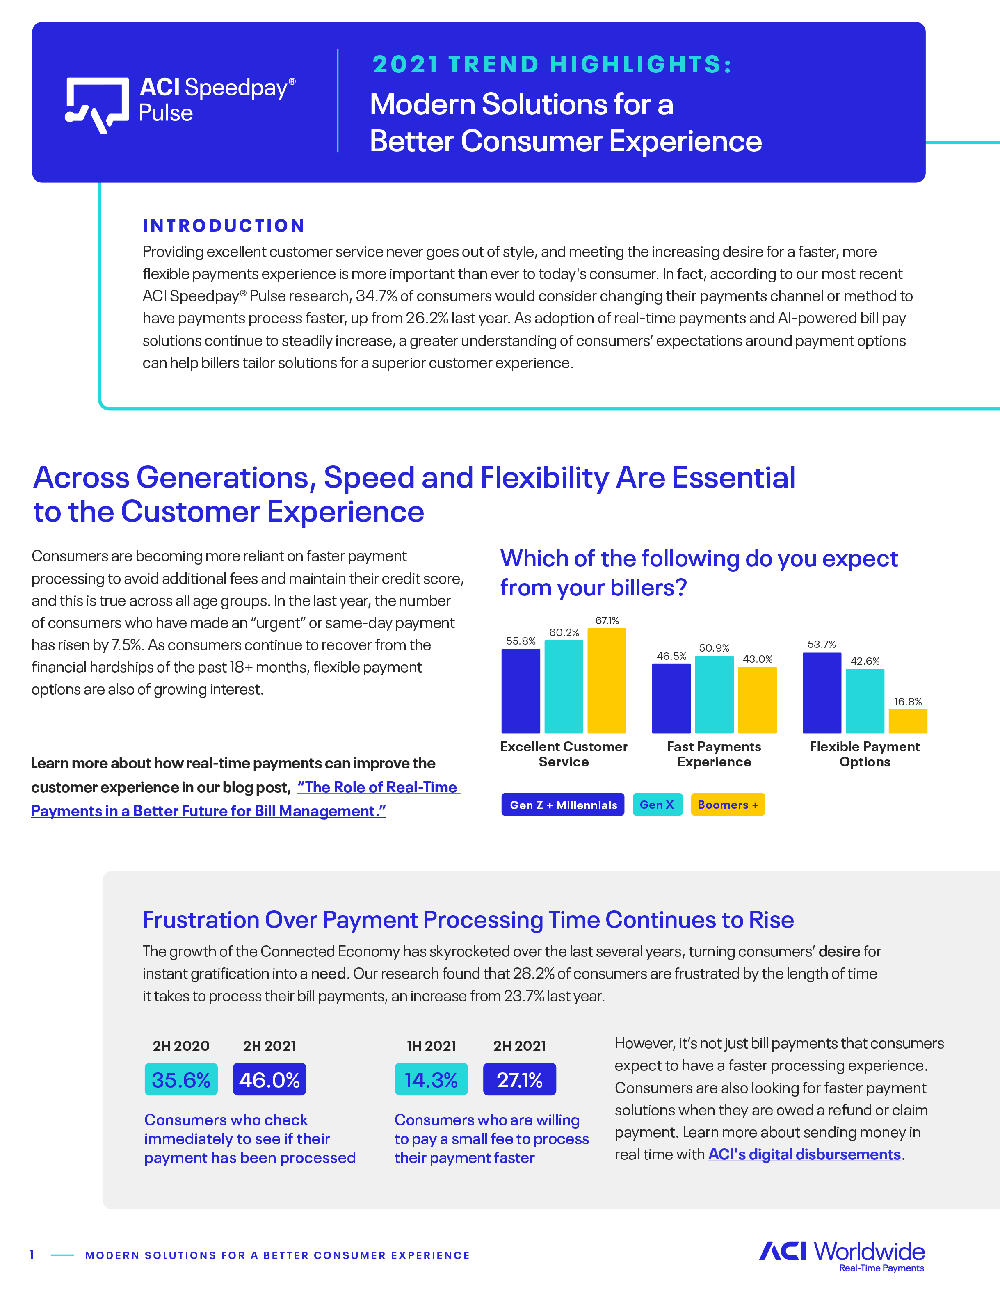
Question: Over the past 12 months, have you had to make an “urgent” or same-day payment?
Question: Assume you had to make an “urgent” or same-day payment tomorrow. Which channel would you prefer to use?*
*Virtual Voice Assistant began to be measured in 1H 2020, while Text Message began to be measured in 2H 2020.
Question: Assume you had to make an “urgent” or same-day payment tomorrow. Which method would you prefer to use?
Now we’ll explore trends related to the rise in popularity of mobile wallets for bill payment.
Question: Do you currently use mobile wallet payment methods to make any sort of payment?
Question: How frequently do you use mobile wallet payment methods to make a payment?
Question: Have you ever paid a bill through a mobile wallet?
(When we say “a bill,” we are referring to your monthly bills that we have previously asked about.)Question: Whether or not you currently use a mobile wallet to pay bills, would you consider doing so in the future?
Take a look at the latest trends in payment security.
Question: How confident are you that your financial data is secure when making bill payments?
Question: Do you believe that mobile wallet payments are secure?
Question: Do you believe your data is more secure than it was 5 years ago?
Question: How do you remember your passwords for the online portals or mobile apps where you pay your bills digitally?
Question: How often do you change the passwords for the online portals or mobile apps where you pay your bills digitally?
Question: If you were to experience a cyberattack, which of the following types of information would you be most concerned about compromising?
Take a look at some of the latest trends in how consumers perceive their bill pay experience.
Question: Do you think the bill payments experience is complicated?
Question: How often do the following statements describe how you feel about your bills and bill payment experience?
Take a look at trends in disbursements, or the money consumers are receiving from their billers and other companies where they’ve purchased products or services.
Question: Not including income tax refunds or stimulus payments from the government, have you received any payments from companies you have purchased products or services from? This can include refunds or rebates of any kind.
Question: Please select all of the payments that you have received.
Question: How did you receive your payment? If you received multiple payments, please think of the most recent payment.
Question: Did you experience any issues in receiving your money?
Question: Please select any kind of issue(s) that you experienced.
Question: Did the company that paid you give you a choice in payment method?
Question: If you were provided a choice, how would you prefer to receive a payment?
To conclude, let’s review consumers’ spending habits surrounding subscription services.
Question: How many subscription services do you currently pay for?
Question: Do you currently share any of your subscription services with other people?
Question: Do you ever split the cost of your subscription service with those people with whom you share?
Source: ACI Worldwide, ACI Speedpay Pulse, 2025
https://pulsereport.aciworldwide.com
The ACI Speedpay Pulse is a longitudinal consumer billing and payment trends research study conducted by Brownstein Group in partnership with ACI Worldwide.
Each ACI Speedpay Pulse data set includes responses from a survey of at least 3,000 unique respondents (no repeat participation within a one-year period). Each survey sample is U.S. Census-balanced among adults age 18 and older who are responsible for submitting payments for at least two of their household’s monthly bills. Survey margin of error is less than 1.8 percent for questions answered by the entire sample. Questions with a smaller base will have a higher margin of error. If presented, stat testing is at the 95 percent confidence level.


Please fill out the form to get in touch.
You can utilize the filter options available in each chart to view the consumer survey data in a variety of ways. Many charts will provide side-by-side comparison tools so that you can compare one set of data on the left with another set of data on the right. While the filters may vary by chart depending on the data available, here are the different filters you may be able to apply: